
Looking back at 2025 and into early 2026, it has been an uncomfortable time for those who work in (and care deeply about) sustainability. Headlines highlight political headwinds, worsening climate impacts, and high-profile setbacks. Electric vehicles (EVs) are often lumped into this story of disappointment, but is that narrative justified? To stay grounded, it helps to return to the data.
EVs: Driving down greenhouse gas (GHG) emissions from transport
Electric vehicles are a key technology in reducing transport-related GHGs. Road transport accounts for around a sixth of global emissions, and EVs reduce this footprint while sustaining sales, revenue, and broader economic activity.1
This reflects a core belief behind sustainable investing: that economic growth can be decoupled from environmental harm. This concept is often discussed in relation to the Environmental Kuznets Curve, which suggests not only that it is possible to achieve GDP growth alongside reductions in environmental damage, but that economic growth itself may help drive those reductions (Figure 1). Evidence for decoupling has strengthened over time. Research from the Energy and Climate Intelligence Unit found that 89% of emissions now reside in economies that have achieved a degree of decoupling.2 EVs are a prime example of this.
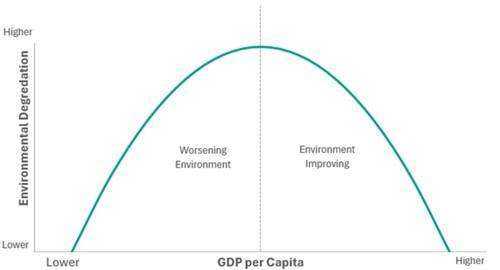
Figure 1: Environmental Kuznets Curve
Long-term market trends
The sales of internal combustion engine (ICE) cars actually peaked as long ago as 2017. In the first 10 months of 2025, EVs made up over a quarter of total global new car sales.3 Since Covid, EVs (including hybrids) have been entirely responsible for all the growth in the automotive sector, see Figure 2.
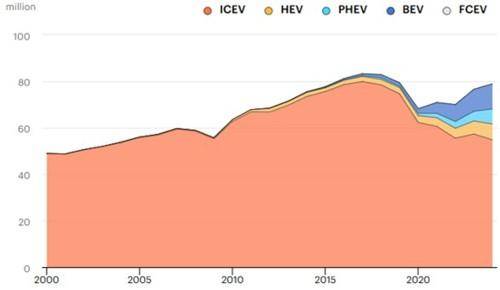
Figure 2: Global new car sales by powertrain, 2000-20244,5
While monthly sales fluctuate and often underpin claims of stalled momentum in the sector, the overall trend remains clearly upward, with 2025 set to be another record year even before December’s data (Figure 3).
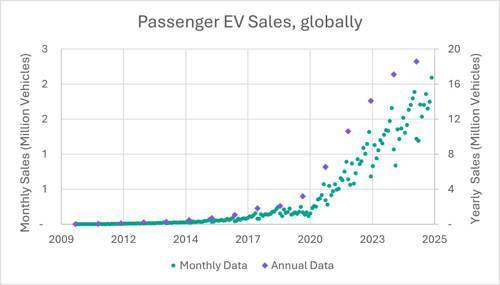
Figure 3: Global passenger EV sales6
Geographic disparity
Traditional climate-solutions narratives suggest richer countries lead and later enable diffusion to developing economies. EVs challenge this framework. China has committed significant financial and strategic resources to secure a central role in EV manufacturing and supply chains, accelerating cost reductions and redefining the geography of climate-solution leadership, as evidenced by China being responsible for over 70% of global production in 2024.7 But it’s not just China. In 2025, almost 40% of Vietnam’s new car sales were EVs, predominantly domestically produced, demonstrating that EV adoption is not limited to high-income countries.8
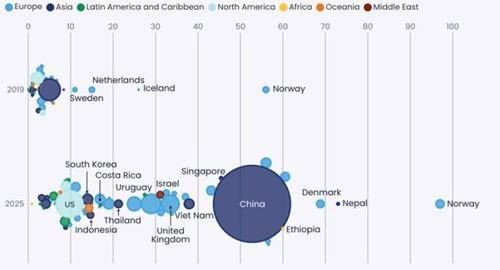
Figure 4: EV share of new passenger car sales(%), 2019 vs 2025. Bubble size relative to quantum of EV sales9
Where does this leave Europe?
In Europe, EV sales rose 30% year on year in November 2025 to over 360,000 units, putting the region on track for another record year.10 This contrasts with negative headlines, which may reflect that the industry is judged against exponential growth, making healthy double-digit growth appear disappointing. Early 2026 forecasts suggest another 13% rise in sales.11,12
Chinese vehicle penetration in Europe remains low, at least in part due to EU tariffs , but slowing growth in China is pushing manufacturers to look abroad, particularly to Europe, for new growth opportunities. Slowing Chinese growth rate is often attributed to the inherent moderation of growth rates as uptake increase. However, with adoption around 50% of new car sales (Figure 4), growth rates would not be expected to dampen yet. Figure 5 shows an example of the expected trajectory for EV adoption.
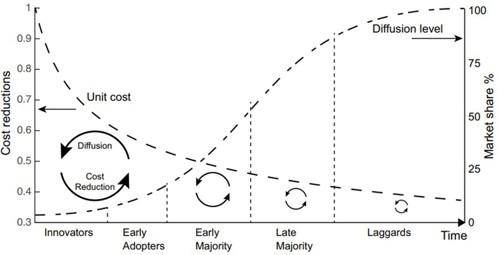
Figure 5: Visual representation of the diffusion curve interacting with the learning curve at different stages of adoption13
The slow might suggest that some challenges still limit full-scale adoption. With rapid advances in charging speeds and infrastructure and EV range, especially solid-state batteries, these hurdles are likely to be overcome soon, leaving the long-term trajectory intact.
Meanwhile, the EU is considering replacing tariffs on Chinese EVs imposed in 2024 with a minimum price per model determined by the Commission. This led to a material share price rise for some Chinese EV manufacturers.14 Additionally, the EU is reviewing its 2035 ban on new ICE vehicles. Headlines suggesting the ban has been scrapped are misleading. In reality, the EU has signalled limited flexibility: up to 10% of tailpipe emissions can be offset via mechanisms such as e-fuels, biofuels, or green steel. Manufacturers have responded confirming that their EV transition plans remain largely unaffected.15
The long-term picture remains clear
The EV transition is uneven and noisy, shaped by geopolitics, industrial policy, and market dynamics. While we will continue to closely monitor developments, including the outcome of the EU’s 2026 review, the long-term trends remain clear: ICE sales are declining, and EV adoption is rising rapidly, in turn driving global decoupling of growth from emissions in road transport.
EVs are far more efficient than ICE vehicles, often up to three times more.16 They also reduce dependence on imported oil, enabling countries to rely on domestically generated electricity. This is particularly important for countries with limited fossil fuel resources, such as Nepal, where EV uptake is already notable (Figure 4) and made even more urgent in a terse geopolitical climate.
For the WHEB strategy, the focus remains on the enabling technologies driving this electrification. Portfolio companies such as TE Connectivity, Infineon Technologies, and Aptiv are well-positioned to benefit as EV adoption continues to grow, while driving down emissions from road transport.
1 IEA.
2 https://eciu.net/media/press-releases/2025/92-of-the-global-economy-is-decoupling-emissions-from-growth
3 https://ember-energy.org/app/uploads/2025/12/The-EV-leapfrog-PDF.pdf
4 https://www.iea.org/reports/what-next-for-the-global-car-industry/the-global-car-industry-in-context
5 ICEV = Internal Combustion Engine Vehicles, HEV = Hybrid Electric Vehicles, PHEV = Plug-in Hybrid Electric Vehicles, BEV = Battery Electric Vehicles, FCEV= Fuel Cell Electric Vehicles.
6 Data from BNEF. Including BEV, PHEV, and FCEV (not including HEV). Data up to and including November 2025.
7 IEA.
8 https://ember-energy.org/app/uploads/2025/12/The-EV-leapfrog-PDF.pdf
9 Graph from EMBER, see: https://ember-energy.org/app/uploads/2025/12/The-EV-leapfrog-PDF.pdf. EVs include plug-in hybrid electric vehicles and battery electric vehicles. Sales figures in 2025 are an estimate assuming the same year-on-year change seen so far in 2025 continues until the end of the year.
10 BloombergNEF.
11 For example: https://www.ft.com/content/c6423ebf-3b26-4445-aef0-1ed9d25ddb99
12 https://www.ft.com/content/1c7d0e22-ea15-400f-ad05-69abe13be23c
13 Mercure, J.-F. et al. (2025) ‘Evidence of a cascading positive tipping point towards Electric Vehicles’, Nature Communications, 17(1). doi:10.1038/s41467-025-66945-9.
14 https://www.bloomberg.com/news/articles/2026-01-13/china-ev-makers-rise-as-eu-mulls-minimum-price-to-replace-tariff?embedded-checkout=true
15 https://www.ft.com/content/97ba22b4-6db0-4cce-9418-96950964beff
16 Alanazi, F. (2023) ‘Electric vehicles: Benefits, challenges, and potential solutions for widespread adaptation’, Applied Sciences, 13(10), p. 6016. doi:10.3390/app13106016.


