Water utilities – a carrier or a barrier to solving sustainability challenges

Last year, I wrote about how UK water utilities have gone from ‘hero to zero’ over the last few decades.1 Deregulation and chronic underinvestment have exacerbated the water pollution problem in the UK, severely damaging the reputation of the industry. Several water companies have also been heavily criticised for prioritising shareholder dividends over reinvestment. Since privatisation in 1989, Britain’s water companies have paid out £78 billion in dividends, nearly half of the £190 billion invested in water infrastructure.2 From 2020 to 2023, water companies underspent 27% of their forecast allowance on water and wastewater enhancement activities.3 This raises the question: why don’t water utilities invest more in infrastructure improvement?
The UK’s short-sighted regulation
UK water utilities have struggled with under-investment since the sector was privatised. One primary reason is that the UK’s regulatory model for water is not fit for purpose. It was not designed to address the sustainability challenges the world is currently facing, such as urbanisation, increasing water shortages and more frequent extreme weather conditions.
The UK water regulator, Ofwat, uses the Regulatory Capital Value (RCV) model to set price controls and determine the allowable return on investments for water companies. The RCV represents the total value of a water company’s assets used to provide services to customers. These price controls are intended to balance affordability for consumers with the need for investment.
However, this model often results in a focus on short-term cost management rather than long-term investment. The current system requires regulators to be sceptical of long-term new investment proposals, whose benefits are often difficult to prove.4 Consequently, priorities are often given to cheaper, short-term solutions.
Financial prioritisation
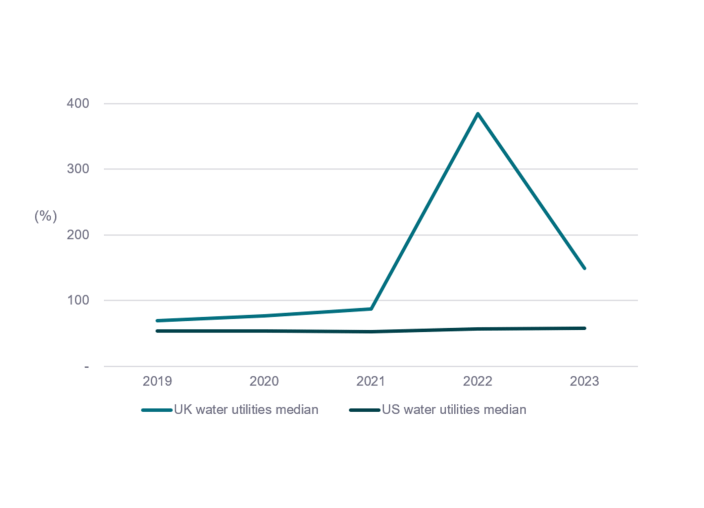
This well-intended but poorly designed regulation leads water companies to Increase debt and prioritise excessive dividend returns to shareholders.5 Compared to their US peers, many UK water companies operate with much higher debt-to-equity ratios and dividend payout ratios. This focus on dividends has diverted necessary funds away from upgrading ageing infrastructure, leading to frequent sewage spills and environmental violations.
Figure 1: Debt to equity ratios at water utilities in the UK vs US 6
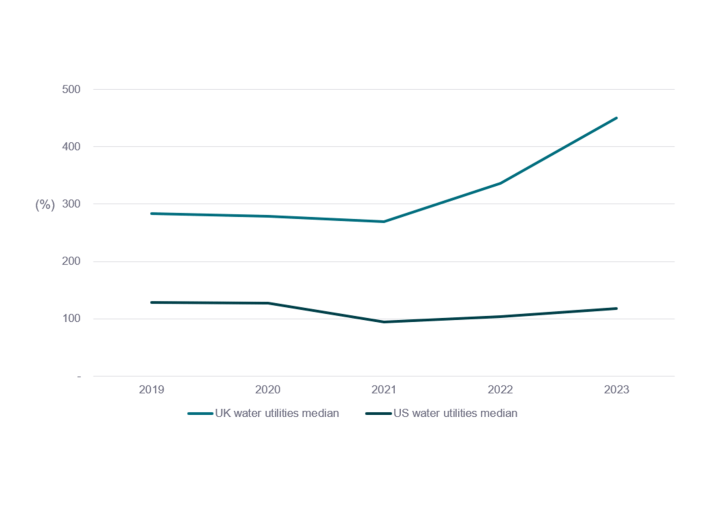
Figure 2: Dividend payout ratios at water utilities in UK vs US 7
The US: A different paradigm
There is an increasingly widespread view that the privatisation of the UK water utility industry has not worked. However, if we look across the pond, it is the exact opposite. Investor-owned water utilities in the US perform much better than municipality-owned utilities in terms of water quality, efficiency and compliance.8
US water infrastructure faces its own challenges including ageing infrastructure, the widespread use of lead in water piping, PFAS contamination and fragmented water systems. Americans also use more water per person than almost anywhere else in the world – more than three times per capita consumption in China and 15 times more than in Denmark.9
To address these challenges, US investor-owned water utilities are offered a different set of incentives compared to their UK counterparts. These companies are regulated by state public utility commissions that often allow for higher returns on equity. They typically receive approved returns on equity in the range of 9% to 10%10 whereas the UK’s allowed return on equity is only 6.27%.11 These attractive returns help attract private investment and ensure that utilities have the necessary capital to maintain and upgrade infrastructure while providing reliable services.
Many states also provide mechanisms like the Infrastructure Surcharge Mechanism (ISM) which allow utilities to recover the costs of infrastructure investments more quickly. This incentivises utilities to invest in upgrading their infrastructure, as they can recoup their expenditures without waiting for lengthy price reviews.
Case in point: American Water Works
Due to the stark differences in market dynamics and regulatory environments between the UK and the US, our view on the environmental impact of water utilities in these countries diverges significantly. In the US, we observe that investor-owned water utilities generally have a positive impact by accelerating capital investment in water infrastructure which in turn improves drinking water quality.12
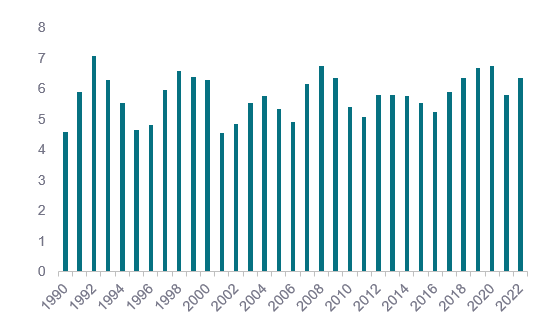
American Water Works (AWK) exemplifies the benefits of the US regulatory environment. It is the largest and most geographically diverse water and wastewater utility company in the US. The company has proactively improved its pipe renewal rate, reducing the replacement cycle from 250 years in 2009 to approximately 125 years by 2028. Its capital investment grew at a 10% compound annual growth rate (CAGR) from 2013 to 2022, compared to just 3.5% for the UK water industry during the same period.13 In real terms, the capital expenditure by UK water utilities has stagnated over the last three decades.
Figure 3: Capital expenditure in the UK water industry (£bn) 14
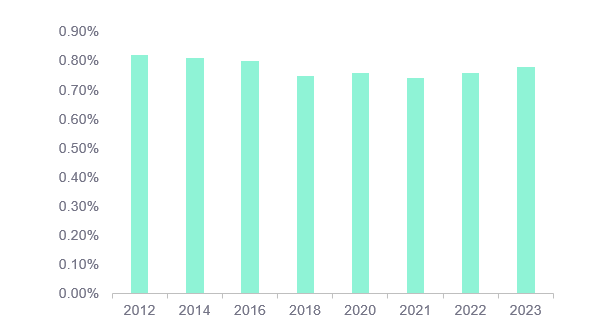
AWK employs a range of advanced tools to enhance water efficiency, including continuous acoustic monitoring of water mains, sensor technologies, improved pressure control, smart distribution systems, and advanced metering infrastructure. As a result of these efforts, the number of main breaks per mile has decreased by 30% from 2014 to 2022.15 Through leveraging overhead costs and ongoing productivity improvement, it has managed to maintain water bill as % of median household income relatively stable over the years.
Figure 4: Monthly water bill as % of median household income 16
AWK’s consistent investment in infrastructure, driven by favourable regulatory conditions and financial flexibility, solidifies its leadership in the sector. Its strong commitment to sustainability is evident in its superior compliance with drinking water and wastewater standards, as well as its numerous water quality accolades. These compelling attributes make AWK an attractive addition to our portfolio this quarter.
Investing for impact
The comparison between UK and US water utilities highlights a significant divergence in their ability to generate positive environmental impact. While UK water companies struggle under a regulatory framework that limits long-term investment, US investor-owned utilities thrive in a supportive regulatory environment that incentivises infrastructure improvements. By investing in companies like AWK, we aim to support and benefit from the proactive and responsible management of water resources. This investment approach ensures long-term sustainability and resilience in the face of growing global water challenges.
Sign up here to receive our monthly and quarterly commentaries in your inbox.
1 https://www.whebgroup.com/our-thoughts/uk-water-companies-from-hero-to-zero
2https://www.ft.com/content/c3cdfefb-c912-4699-bb7f-72c5c6515757
3 https://www.ofwat.gov.uk/wp-content/uploads/2023/09/Water-Company-Performance-Report-2022-23.pdf
4 https://nic.org.uk/app/uploads/NIC-Strategic-Investment-Public-Confidence-October-2019.pdf
5 https://www.ofgem.gov.uk/sites/default/files/docs/2009/10/rcv-critique-29.pdf
6 Data source: FactSet. UK companies include Pennon, United Utilities and Severn Trent. US companies include American Water Works, California Water Service and American States Water.
7 ibid
8 https://nawc.org/wp-content/uploads/2023/09/TFTT-factsheet-ByTheNumbers.pdf
9 https://www.nasdaq.com/articles/state-of-the-water-industry-2021-2021-10-04
10 https://www.spglobal.com/marketintelligence/en/news-insights/research/water-rate-case-activity-how-it-ebbs-and-flows
11 https://www.ofwat.gov.uk/wp-content/uploads/2019/12/PR19-final-determinations-Aligning-risk-and-return-technical-appendix.pdf
12 https://nawc.org/water-industry/water-quality/
13 https://www.ofwat.gov.uk/wp-content/uploads/2022/05/long_term_data_series.xlsx
14 ibid
15 https://s26.q4cdn.com/750150140/files/doc_downloads/esg_docs/2023/2021-2022-Sustainability-Report.pdf
16 Data source: American Water Works